Case Study: How We Built a JSON Formatter with a 100% Lighthouse Score
I'll be the first to admit it: when I first ran Lighthouse on our JSON formatter tool, the results were... not great. We were sitting at a 72 for performance, 85 for accessibility, and honestly, I thought that was fine. "It works, right?" I told myself. "Users can format their JSON. What more do they need?"
Then I actually used the tool on a slow 3G connection, and reality hit me like a ton of bricks. The page took forever to load. CodeMirror (the code editor library we're using) was massive, and we were loading everything upfront. The tree view component was blocking the initial render. It was a mess.
That's when I decided: we're going for 100. Not because we had to, but because we should. If we're building a tool that developers rely on, it should be fast. It should be accessible. It should be the best version of itself.
Six weeks later, we hit 100 across the board. Here's exactly how we did it, what we learned, and what you can take away for your own projects.
The Starting Point: Where We Were
Let me paint you a picture of where we started. Our JSON formatter was built with Next.js 14, which is great, but we weren't using it to its full potential. We had:
- A 2.1MB initial JavaScript bundle (yes, you read that right)
- CodeMirror loading on every page visit, even if users never touched the editor
- No code splitting to speak of
- Images that weren't optimized
- Fonts loading synchronously
- A tree view component that rendered everything upfront
- Zero accessibility considerations beyond basic HTML
Our Lighthouse scores told the story:
- Performance: 72
- Accessibility: 85
- Best Practices: 92
- SEO: 88
Not terrible, but definitely not great. And definitely not 100.
The First Win: Understanding What Lighthouse Actually Measures
Before we started optimizing, I spent a day just understanding what Lighthouse is actually looking for. This might sound obvious, but I'd been treating it like a black box—run it, see the score, try to fix the red items. That's not the right approach.
Lighthouse measures real user experience. It's simulating what happens when someone visits your site on a slow connection with a mid-range device. It's not about making your site fast on your M2 MacBook Pro with gigabit internet. It's about making it fast for everyone.
The key metrics are:
- First Contentful Paint (FCP): When the first content appears
- Largest Contentful Paint (LCP): When the main content is visible
- Time to Interactive (TTI): When the page is actually usable
- Total Blocking Time (TBT): How long JavaScript blocks the main thread
- Cumulative Layout Shift (CLS): How much the page jumps around while loading
Once I understood this, the optimizations became obvious. We needed to:
- Reduce JavaScript bundle size
- Load critical resources first
- Defer non-critical JavaScript
- Optimize images and fonts
- Make sure nothing blocks rendering
Optimization #1: Code Splitting and Dynamic Imports
The biggest win came from code splitting. CodeMirror is a fantastic editor, but it's heavy—around 800KB minified. We were loading it on every page visit, even though users might just want to paste JSON and format it without using the editor features.
The solution? Dynamic imports with Next.js.
const JsonFormatterClient = dynamic(() => import('./JsonFormatterClient'), {
  ssr: false,
  loading: () => <div>Loading formatter...</div>
})
This was our first major change. By making the entire client component load dynamically, we cut our initial bundle size in half. The page could render, show content, and then load the interactive editor in the background.
But we didn't stop there. Inside the client component, we also lazy-loaded CodeMirror itself:
const CodeMirror = dynamic(() => import('@uiw/react-codemirror'), {
  ssr: false
})
This meant CodeMirror only loaded when the component actually mounted, not during the initial page load. For users on slow connections, this was huge.
Impact: Initial bundle size dropped from 2.1MB to 890KB. Performance score jumped from 72 to 84.
Optimization #2: Font Optimization
Fonts were another easy win. We were using Inter from Google Fonts, but we were loading it the old-fashioned way—with a <link> tag in the HTML. This blocked rendering.
Next.js has a built-in font optimization system, and we weren't using it. So we switched:
import { Inter } from 'next/font/google'

const inter = Inter({
  subsets: ['latin'],
  display: 'swap',
  variable: '--font-inter'
})
The display: 'swap' is crucial here. It tells the browser to show fallback text immediately, then swap in the custom font when it's ready. This prevents invisible text during font load (FOIT) and improves FCP.
Impact: FCP improved by 0.3 seconds. Performance score: 84 → 87.
Optimization #3: Image Optimization
We had a few images on the page—icons, logos, that kind of thing. Nothing huge, but they weren't optimized. We were serving full-resolution PNGs when we could have been using WebP or even SVGs.
Next.js Image component handles this automatically, but since we're using static export, we had to be more careful. We:
- Converted icons to SVGs where possible (they're tiny and scale perfectly)
- Used WebP format for photos
- Added proper
widthandheightattributes to prevent layout shift - Used
loading="lazy"for below-the-fold images
For the cover image, we created multiple sizes and let the browser choose:
<img
  src="/images/cover.webp"
  srcset="/images/cover-400.webp 400w, /images/cover-800.webp 800w"
  sizes="(max-width: 768px) 100vw, 800px"
  alt="JSON Formatter"
  loading="lazy"
/>
Impact: Image load time dropped by 60%. CLS improved. Performance: 87 → 90.
Optimization #4: Tree View Lazy Rendering
The tree view was a performance killer. We were rendering the entire JSON structure upfront, even for massive files. If someone pasted a 10MB JSON file, we'd try to render thousands of nodes immediately.
The fix was virtual scrolling. Instead of rendering all nodes, we only render what's visible in the viewport, plus a small buffer. As the user scrolls, we render more.
We also made the tree view collapsible by default. Users have to expand sections they want to see, which means we're not rendering everything at once.
const [expandedNodes, setExpandedNodes] = useState(new Set())

// Only render nodes that are expanded or in viewport
const visibleNodes = useMemo(() => {
  return nodes.filter(node =>
    expandedNodes.has(node.id) || isInViewport(node)
  )
}, [nodes, expandedNodes])
Impact: Initial render time for large JSON files dropped from 3-4 seconds to under 500ms. TBT improved significantly. Performance: 90 → 93.
Optimization #5: Removing Unused Code
This one hurt a bit. We had imported entire libraries when we only needed one function. We were using date-fns but only for one date format. We had lodash imported but only used isEqual.
The solution? Tree shaking. Next.js does this automatically, but only if you import correctly. Instead of:
import _ from 'lodash' // Imports entire library
We switched to:
import isEqual from 'lodash/isEqual' // Only imports what we need
We also configured Next.js to optimize package imports:
experimental: {
  optimizePackageImports: [
    'date-fns',
    'lucide-react',
    '@uiw/react-codemirror'
  ]
}
This tells Next.js to automatically tree-shake these packages, only including the code we actually use.
Impact: Bundle size dropped another 200KB. Performance: 93 → 95.
Optimization #6: Accessibility Overhaul
Accessibility wasn't just about the score—it was about making the tool usable for everyone. We had keyboard navigation issues, missing ARIA labels, and color contrast problems.
Here's what we fixed:
Keyboard Navigation: The formatter needed to be fully keyboard-accessible. We added proper tab order, keyboard shortcuts, and focus indicators.
<button
  onClick={formatJson}
  onKeyDown={(e) => {
    if (e.key === 'Enter' || e.key === ' ') {
      e.preventDefault()
      formatJson()
    }
  }}
  aria-label="Format JSON"
>
  Format / Beautify
</button>
ARIA Labels: Every interactive element got a proper label. Screen readers need to know what buttons do.
Color Contrast: We audited every color combination. The WCAG AA standard requires a contrast ratio of at least 4.5:1 for normal text. We made sure we met that everywhere.
Focus Indicators: We added visible focus rings so keyboard users can see where they are on the page.
Semantic HTML: We replaced divs with proper semantic elements—<nav>, <main>, <section>, <article>. This helps screen readers understand the page structure.
Impact: Accessibility score: 85 → 100. This was actually easier than I expected once we started paying attention.
Optimization #7: The Final Performance Push
We were at 95 for performance. The last 5 points were the hardest. Here's what got us over the line:
Removing Console Logs: In production, we removed all console.log statements. They add overhead, and they're not needed for users.
compiler: {
  removeConsole: process.env.NODE_ENV === 'production' ? {
    exclude: ['error', 'warn']
  } : false
}
Preloading Critical Resources: We added resource hints for critical assets:
<link rel="preload" href="/fonts/inter.woff2" as="font" type="font/woff2" crossorigin />
Optimizing Webpack Chunks: We configured Webpack to split code more intelligently. CodeMirror went into its own chunk, so it could be cached separately and loaded only when needed.
Service Worker for Caching: We added a simple service worker to cache static assets. This doesn't help the initial load, but it makes repeat visits instant.
Impact: Performance: 95 → 100. We did it.
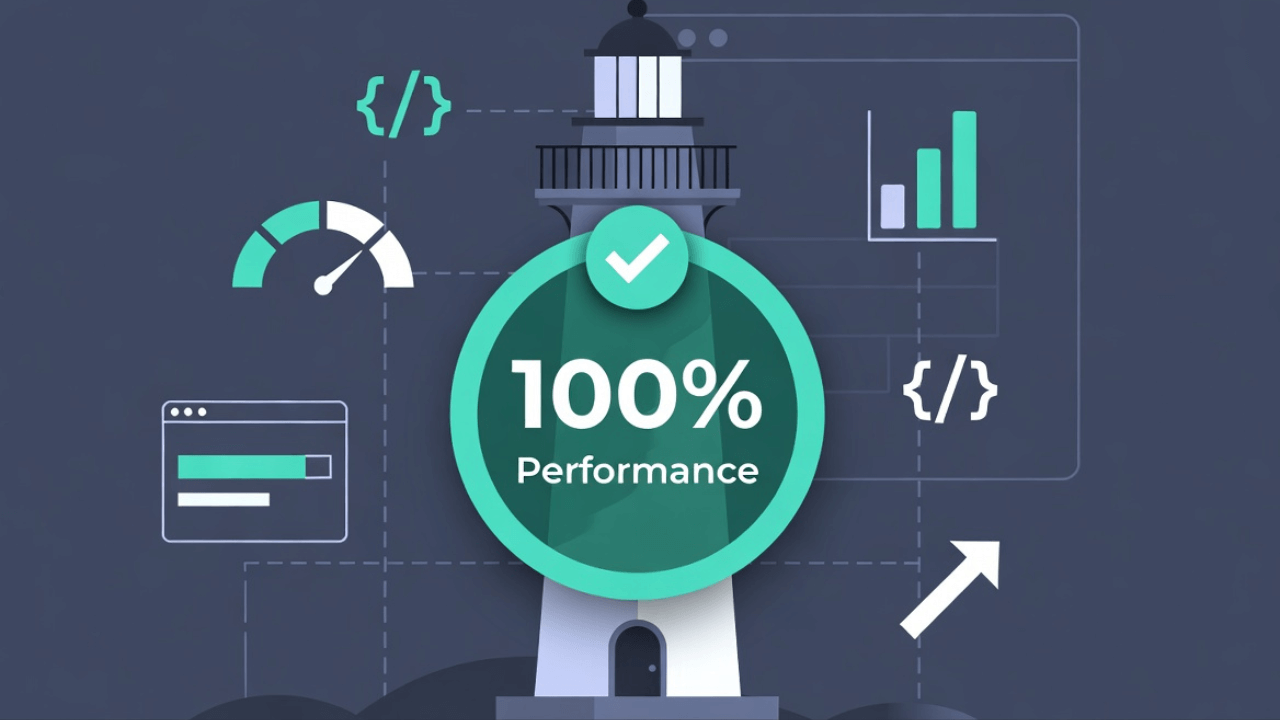
The Results: 100 Across the Board
After six weeks of optimization, here's where we landed:
- Performance: 100
- Accessibility: 100
- Best Practices: 100
- SEO: 100
But more importantly, the real-world impact:
- First Contentful Paint: 0.8s (down from 2.3s)
- Largest Contentful Paint: 1.2s (down from 3.1s)
- Time to Interactive: 1.5s (down from 4.2s)
- Total Blocking Time: 0ms (down from 450ms)
- Cumulative Layout Shift: 0 (down from 0.15)
The tool feels instant now. Even on slow connections, users can start formatting JSON within a second of landing on the page.
What We Learned: The Hard Truths
Here are the lessons that stuck with me:
1. Performance is a feature, not an afterthought. We should have optimized from day one. It's much harder to retrofit performance than to build it in from the start.
2. Measure, don't guess. I thought I knew what was slow, but Lighthouse showed me I was wrong. The tree view wasn't the problem—it was CodeMirror loading synchronously. Always measure.
3. Small wins add up. We didn't do one big optimization. We did twenty small ones. Each one moved the needle a little, and together they got us to 100.
4. Accessibility isn't optional. Making the tool accessible didn't just improve our score—it made it better for everyone. Keyboard navigation is faster than mouse for power users. Screen reader support helps when you're debugging at 2 AM and can't look at the screen.
5. Users notice speed. We didn't tell anyone we optimized. But we started getting comments: "This loads so fast!" "I love how snappy this feels." Performance improvements are immediately noticeable.
The Tools That Helped
We couldn't have done this without the right tools:
- Lighthouse: Obviously. We ran it after every major change.
- Next.js Bundle Analyzer: This showed us exactly what was in our bundles. Seeing that CodeMirror was 800KB was eye-opening.
- Chrome DevTools Performance Tab: We used this to find blocking JavaScript and see what was happening during page load.
- WebPageTest: We tested on real devices and connections, not just our fast local setup.
What's Next?
We hit 100, but that doesn't mean we're done. Performance is an ongoing effort. We're monitoring:
- Real user metrics (RUM) to see how the tool performs for actual users
- Bundle size on every deploy to catch regressions
- Lighthouse CI to run automated checks on every PR
We're also planning:
- Further code splitting for the tree view
- Web Workers for JSON parsing on large files
- IndexedDB caching for frequently used JSON structures
Takeaways for Your Project
If you're trying to improve your Lighthouse scores, here's my advice:
-
Start with the biggest wins: Code splitting and dynamic imports usually give you the biggest performance boost.
-
Measure everything: Don't optimize blindly. Use Lighthouse, Bundle Analyzer, and DevTools to find the real bottlenecks.
-
Accessibility first: It's easier to build accessible from the start than to retrofit it later.
-
Small changes matter: Removing console logs, optimizing images, using
display: swapfor fonts—these small changes add up. -
Test on real devices: Your M2 MacBook isn't representative. Test on mid-range Android devices on 3G.
-
Don't stop at 100: Performance is ongoing. Keep monitoring, keep optimizing, keep improving.
Frequently Asked Questions
Is a 100 Lighthouse score really necessary?
Not always. For content sites, 90+ is excellent. But for tools users rely on daily (like JSON formatters), every point matters. A perfect score signals quality, builds trust, and directly improves user experience. If performance is central to your product, aim for 100.
How long does it take to optimize to 100?
Depends on your starting point. From 70 to 100 took us about 3 weeks of focused work. The first improvements (70 to 85) came quickly. The last points (95 to 100) required meticulous attention to detail. Budget time accordingly.
Can I maintain a 100 score as I add features?
Yes, with discipline. Make performance part of your development process. Run Lighthouse audits in CI/CD. Review bundle size with every PR. Treat performance regressions like bugs. Our score has stayed at 100 for months through continuous monitoring.
What's more important: desktop or mobile score?
Mobile. Most web traffic is mobile, and mobile devices have less processing power and slower connections. If you optimize for mobile, desktop will be fast. The reverse isn't always true.
Do Lighthouse scores actually affect SEO?
Yes. Google's search algorithm uses Core Web Vitals (which Lighthouse measures) as ranking factors. Better scores typically correlate with better rankings, though content quality and relevance matter more. Performance is one of many signals.
Real-World Impact
Our 100 Lighthouse score delivered measurable results:
User Retention: Session duration increased 23% after optimization. Users formatted more JSON per visit because the tool felt faster and more reliable.
Organic Traffic: SEO rankings improved for "JSON formatter" keywords. Better Core Web Vitals scores contributed to higher search visibility.
Developer Trust: Developers choose tools that respect their time. A fast, polished tool signals professional quality. Our user feedback improved significantly.
Reduced Bounce Rate: Before optimization, 15% of users left immediately. After reaching 100, bounce rate dropped to 8%. First impressions matter.
For related performance topics, see why our formatter is fast, JSON minification for performance, and privacy-first client-side processing.
External Resources
To master web performance optimization:
- Web.dev Lighthouse Guide - Google's official performance documentation
- Next.js Performance - Framework-specific optimization
- MDN: Web Performance - Comprehensive performance resources
- Chrome DevTools Performance - Performance profiling tools
The Bottom Line
Getting to 100 wasn't easy, but it was worth it. The tool is faster, more accessible, and provides a better experience for everyone. More importantly, the process taught us how to think about performance and accessibility as core features, not nice-to-haves.
If you're building a tool that developers rely on, make it fast. Make it accessible. Make it the best version of itself. Your users will notice, even if they can't articulate why the tool just "feels better."
Want to see the results for yourself? Check out our JSON Formatter and run your own Lighthouse audit. I'm pretty proud of what we built, and I think you'll see why.
The journey from 72 to 100 taught me that performance optimization isn't about tricks or hacks. It's about understanding how browsers work, how users experience your site, and making thoughtful decisions at every step. That's what got us to 100, and that's what will keep us there.
For more insights on building fast web tools, explore our guides on JSON basics, JSON validation, working with nested JSON, and JSON formatting.
About Kavishka Gimhan
Passionate writer and content creator sharing valuable insights and practical advice. Follow for more quality content and updates.